Data Science × Storytelling
Turning data into stories people feel.
I'm Ryan, a data scientist and data designer based in Manila. I build interactive visualizations and scrollytelling experiences that make complex data legible and memorable.
Visual Stories
See the
data.
D3.js · GeoJSON · 2024
Ring of Fire — Philippines Earthquakes
A seismic portrait of the Philippines: 18,000 tremors mapped, sorted, and brought to life.
Svelte · D3.js · 2023
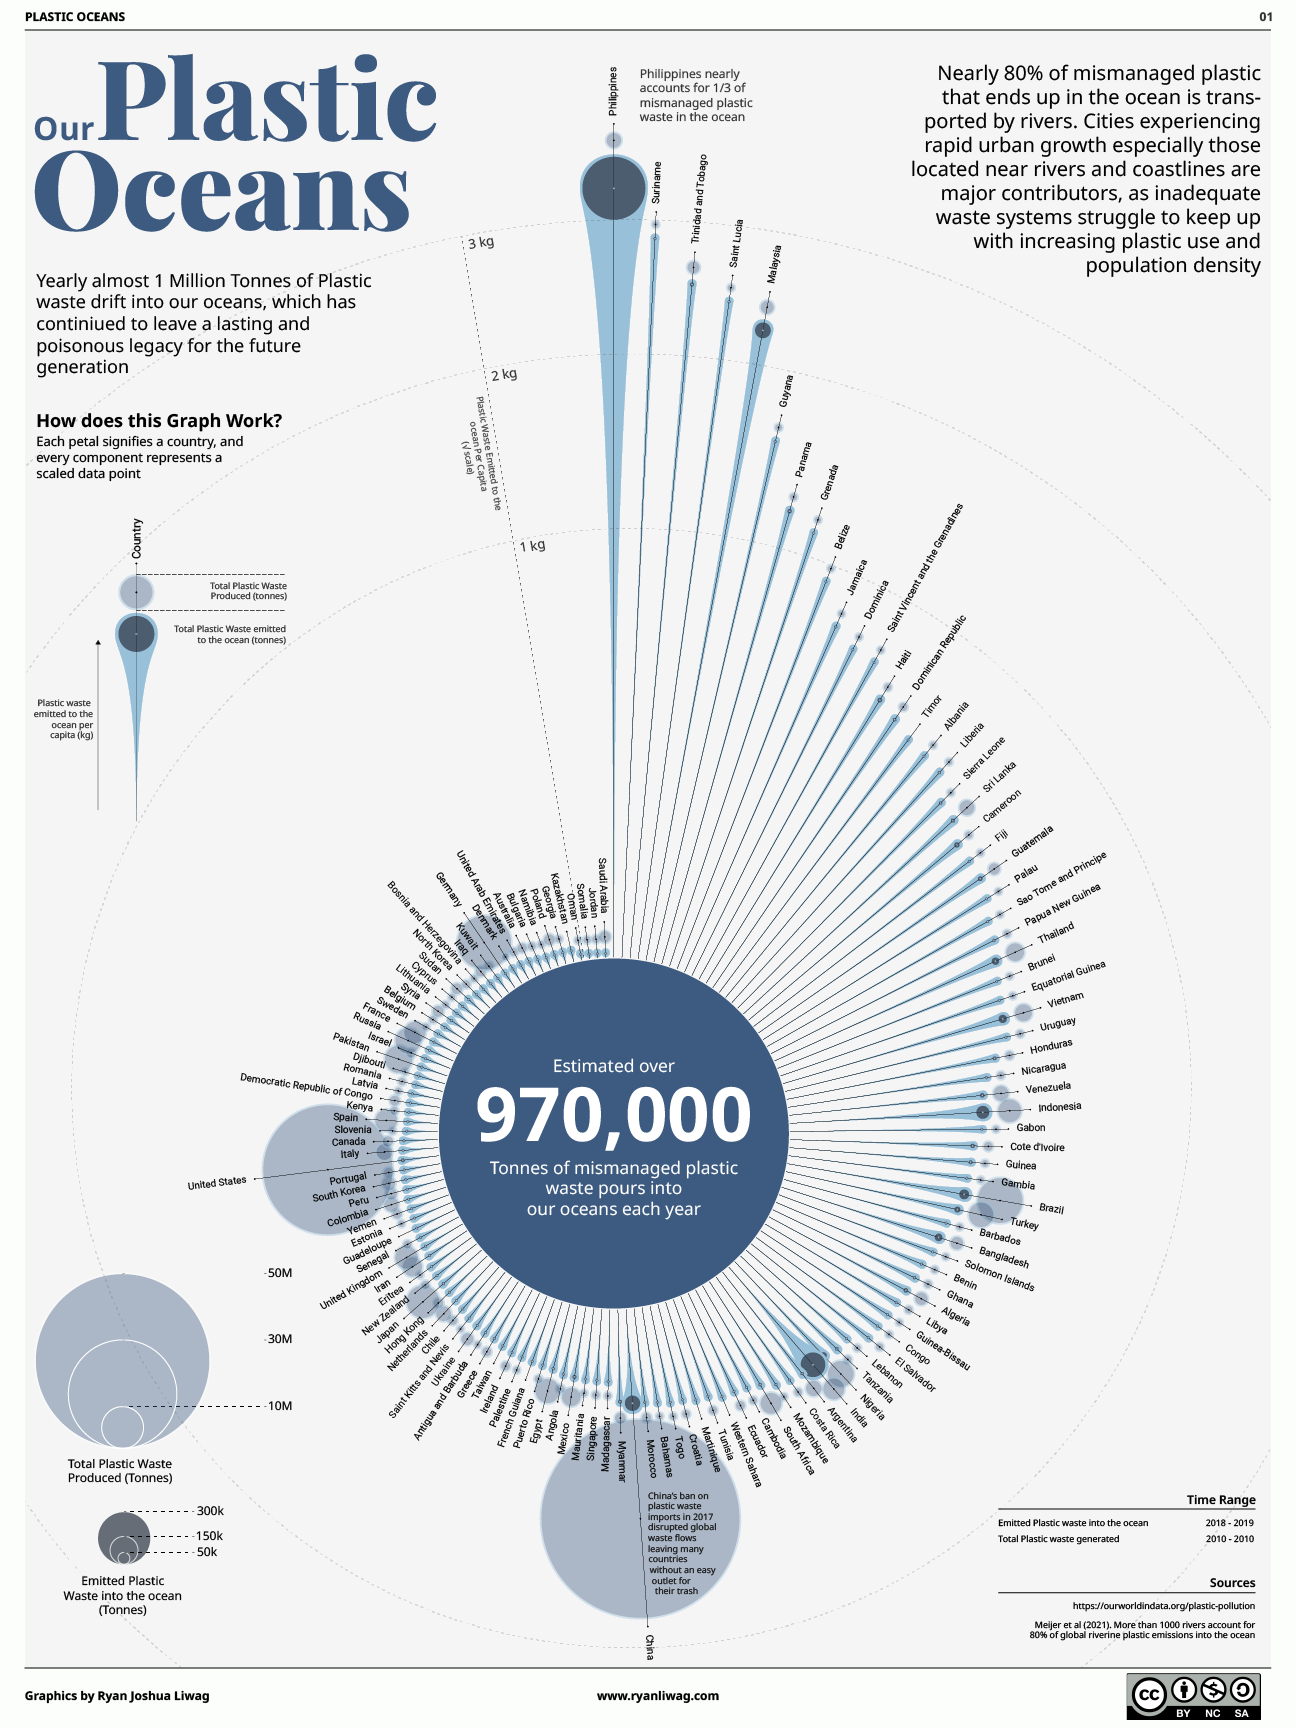
Plastic Oceans — Philippines
How a sachet economy made one nation responsible for a third of the world's ocean plastic.
Projects
Work that
earns its keep.
 01/
01/- Svelte
- D3.js
- Canvas API
- GSAP
Ring of Fire
An interactive canvas-based scrollytelling story mapping 18,139 Philippine earthquakes from 2024, animated through five data views.
→ 02/
02/- Svelte
- D3.js
- GSAP
- Illustrator
Plastic Oceans
A static infographic using non-traditional visualization to show why the Philippines is responsible for a third of all ocean plastic.
→ 03/
03/- Svelte
- D3.js
- GSAP
- Illustrator
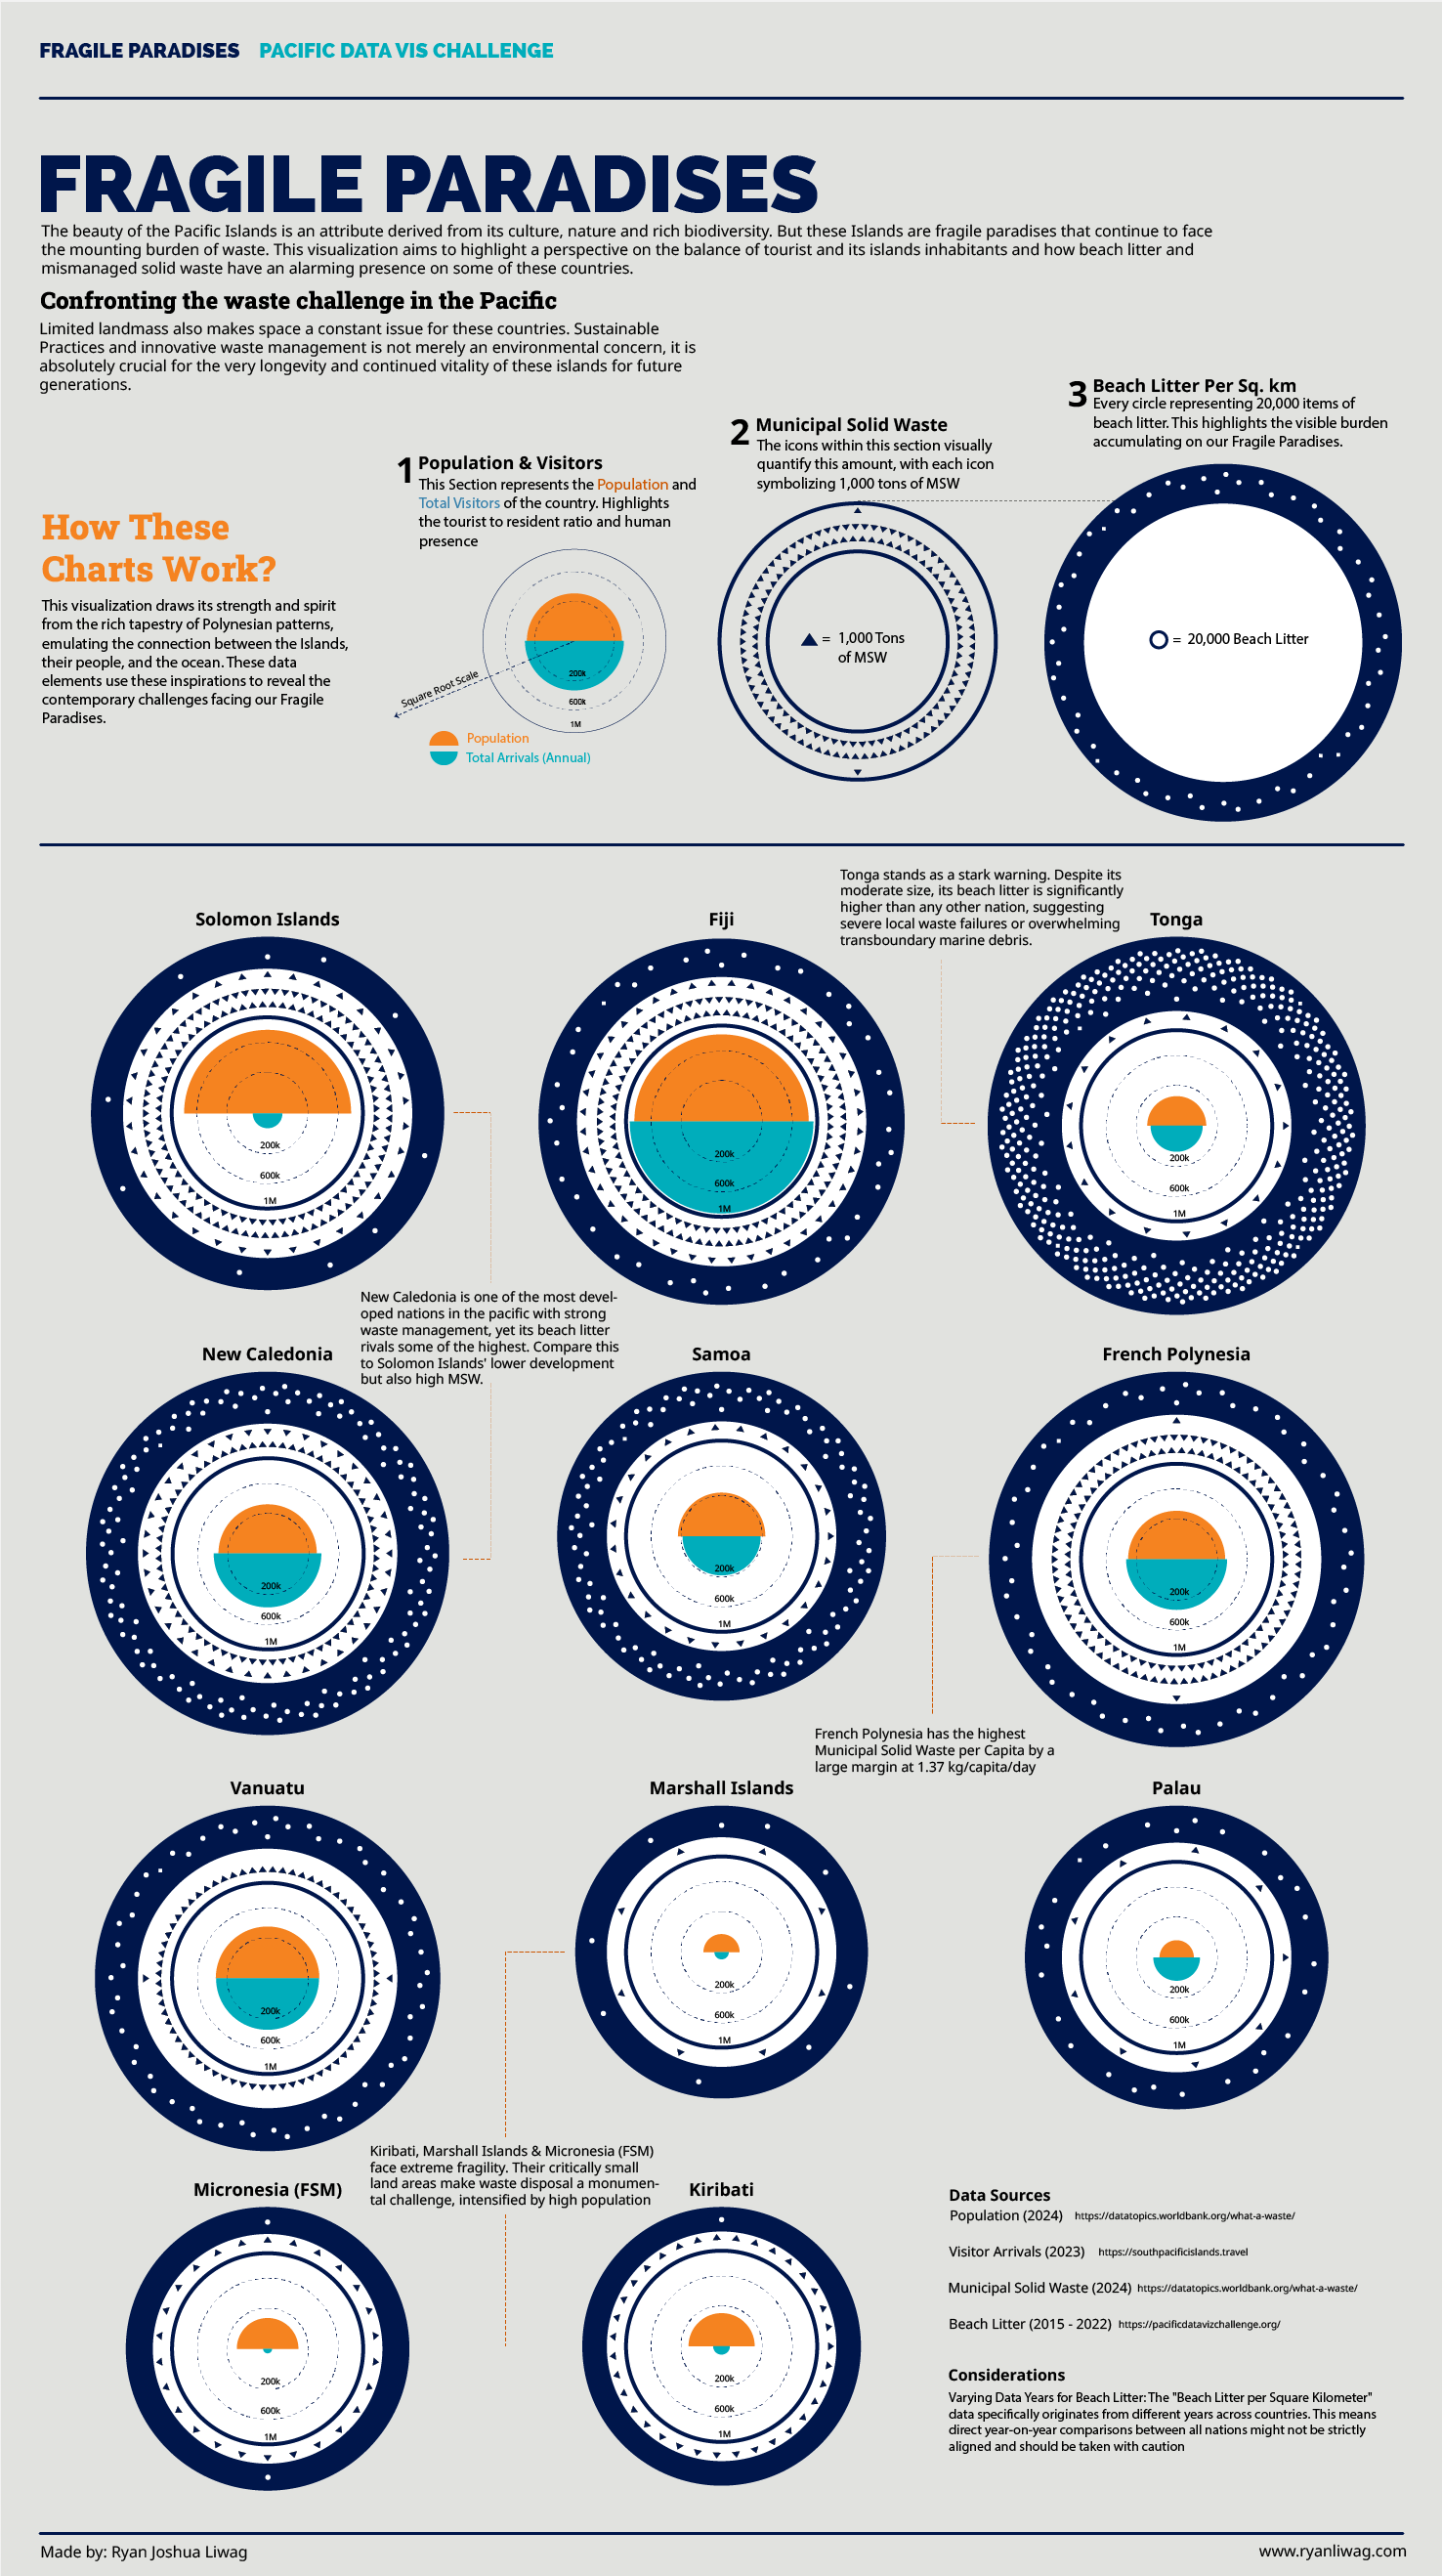
Fragile Paradises
A competition entry exploring how tourism and population pressure are driving a waste crisis across the Pacific Islands.
→
Writing
From the
notebook.
Statistics · May 2026
P < 0.05 and Other Lies We Tell Ourselves
The p-value is a golem, stop treating it as anything more
Data Science · Jun 2024
The Most Important Skill in Data Science, I Think
A hot take on the single most valuable skill a data scientist can have — and it's not the one everyone talks about.
Book Review · Jun 2023
Red Rising Review
The Red Rising trilogy starts slow but delivers one of the best payoffs in recent sci-fi.
Book Review · Apr 2023
Children of Time Review
Adrian Tchaikovsky's novel told through the eyes of evolving spiders — and it's brilliant.
About
Based in Manila.
Building with data.
I'm Ryan Liwag, a data scientist and data designer based in Manila, Philippines. I combine analytical thinking with visual storytelling: machine learning, dashboards, interactive explainers, and scrollytelling pieces that turn raw data into something people can actually feel.
This site is my portfolio and creative sandbox, built from scratch with Svelte, designed to reflect the same principles I bring to my work: clarity, structure, and a bit of personality.
More about me →What I do
- Interactive data storytelling
- Scrollytelling & web experiences
- Custom dashboards & reports
- Infographics & visual explainers
- Data-to-web development
- Training & workshops