Visualizing Ireland Maynooth's Emission
Published on September 15, 2023
1min to read
Purpose of the Visualization
Link to the visualization: https://unravelled.vercel.app/
In Ireland, there is a goal to reduce carbon emission targets by 51% by 2030 and reach net zero by 2050. To achieve this every local authority in the country was asked to select a Decarbonising Zone- an area where climate and biodiversity measures are trialled. And Maynooth was selected as one of the decarbonizing zones.
This project was commisioned by the local goverment in maynooth to visualize the emission baseline and visualize the emission goals.
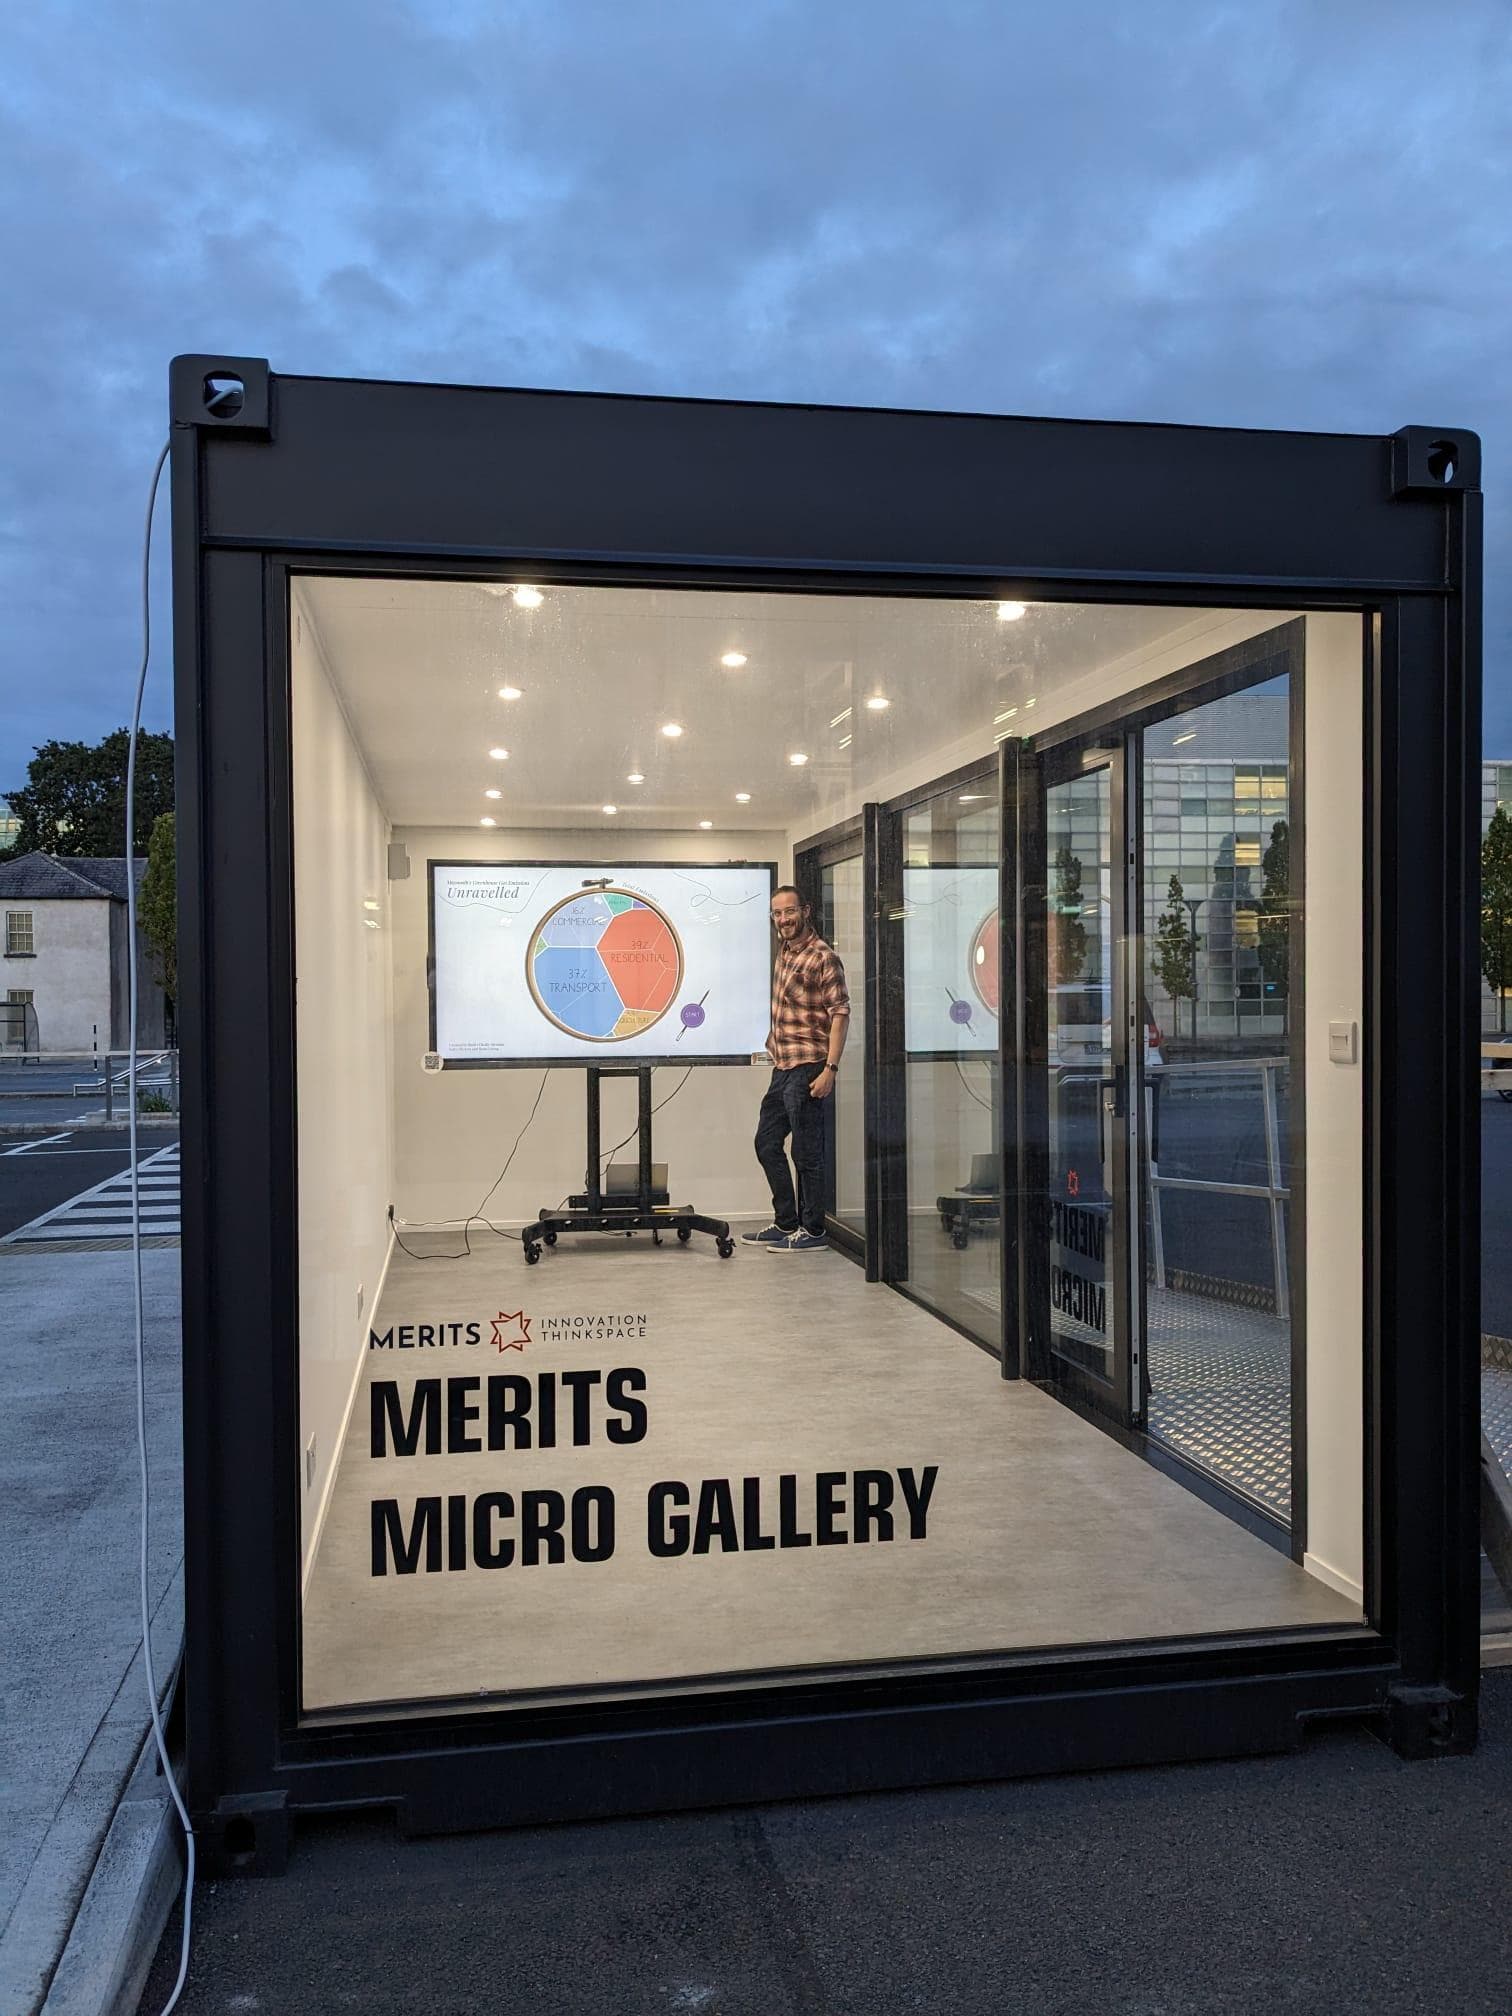
The Visualization
The visualization was displayed almost like a art exibit in Ireland, where the vent had a theme centered around woven fabric and cloth. The event's theme also had a huge factor in in influencing the design of the visualization.
Voronoi Implementation
My main contribution to the visualization is through the implementation of the interactive voronoi hoop. It was built on svelte and mainly uses d3 for the calculations and gsap for the animations.
1st Pass
My initial implementation was just to get d3 heirrarchy and voronoi working with svelte.
2nd Pass
Next I started integrating gsap with the animation and also saving/calculating previous voronoi states to animate back and forth.
3rd Pass
Started to refine the animation and add text to the voronoi
Final View